Animated Chart Components for React
Charts built by hand in SVG and canvas, filled with the same liquid and dither shaders as the rest of the catalog. An area chart and bars whose ink flows, a multi-series line chart, a streamgraph of stacked shader bands, a donut, pie, gauge, heatmap and ranked bar list rendered as halftone print, and a row of stat tiles with sparklines. Each one has hover detail, keyboard access, and a screen-reader description of the data.
10 components · Browse all components
Components
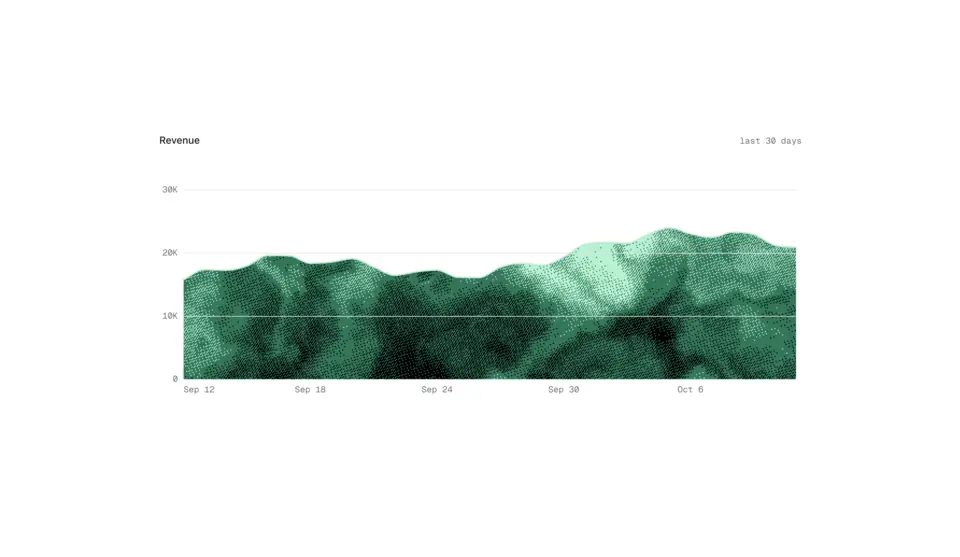
Shader Area
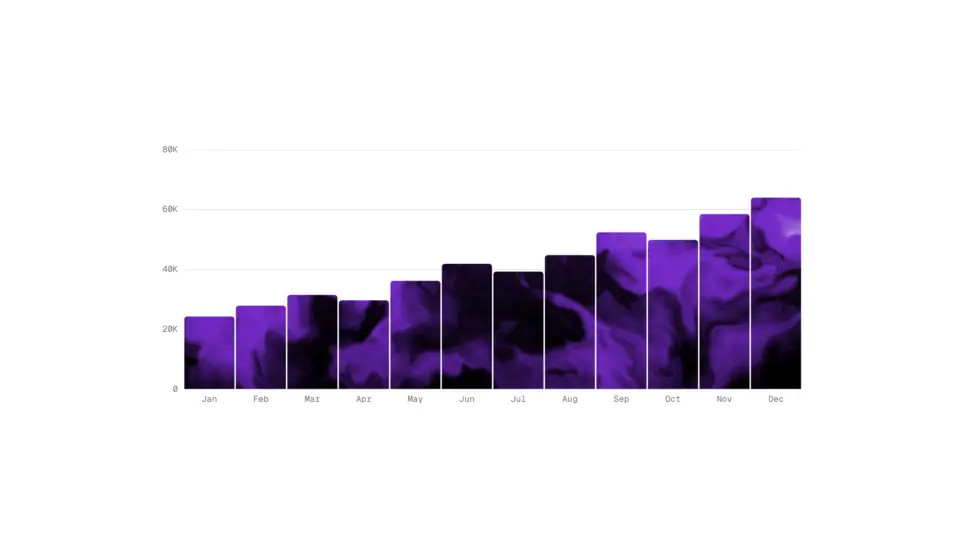
Shader Bars
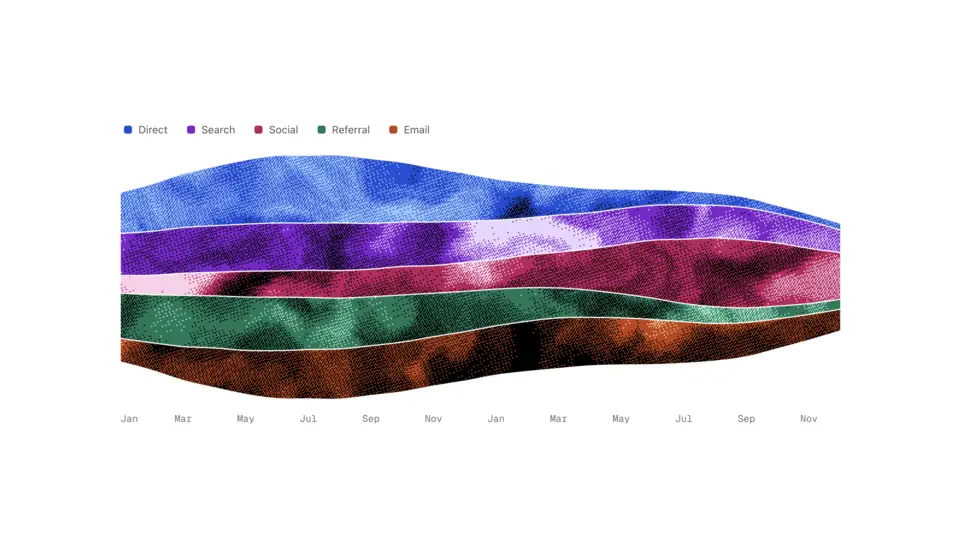
Shader Stream
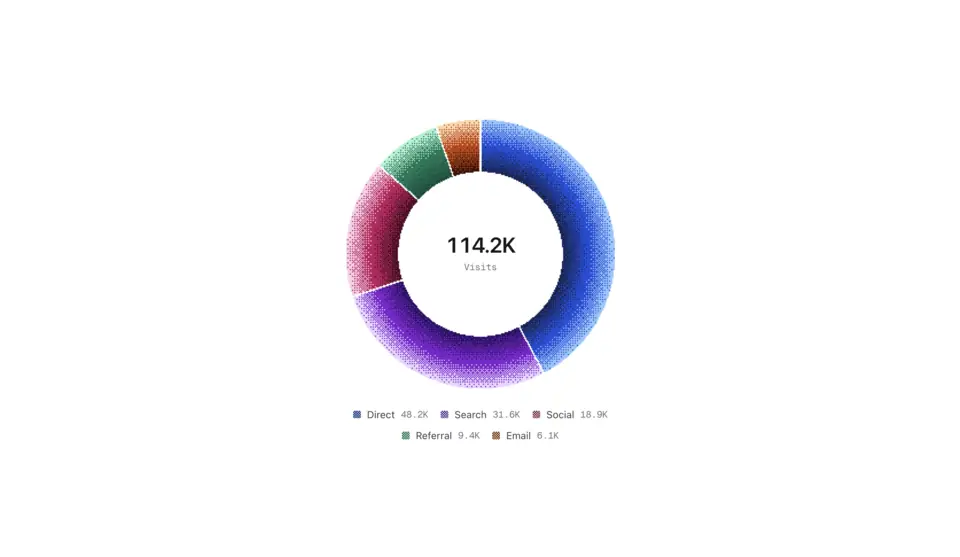
Dither Donut
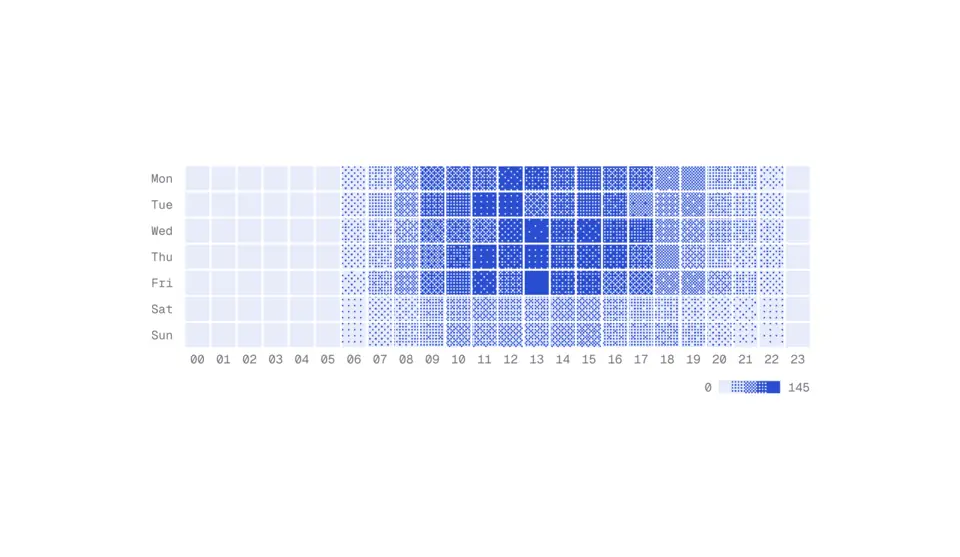
Dither Heatmap
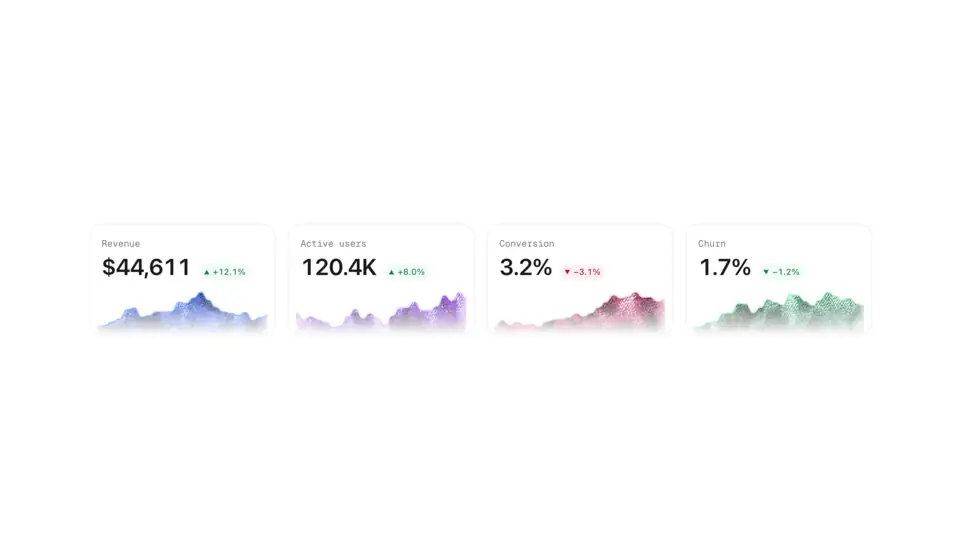
Shader Stat Tiles
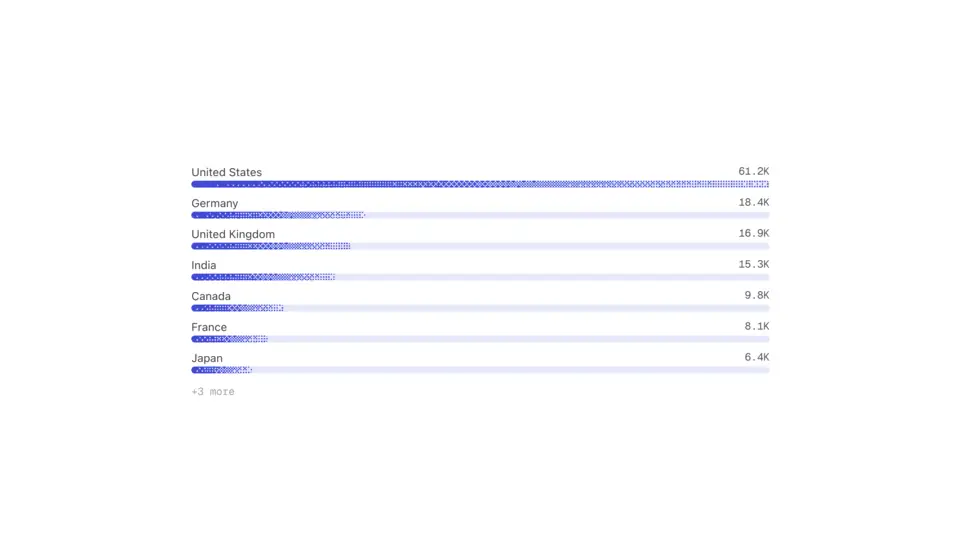
Dither Bar List
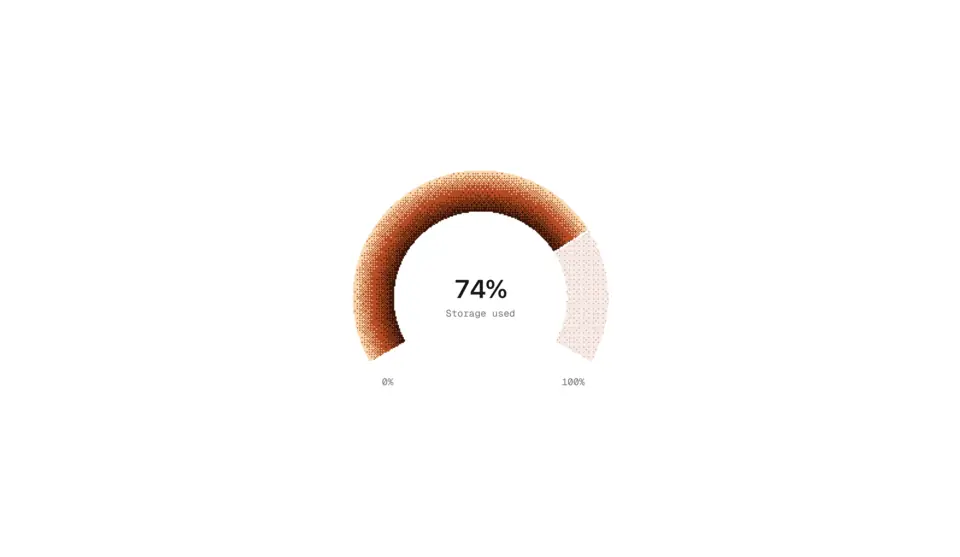
Dither Gauge
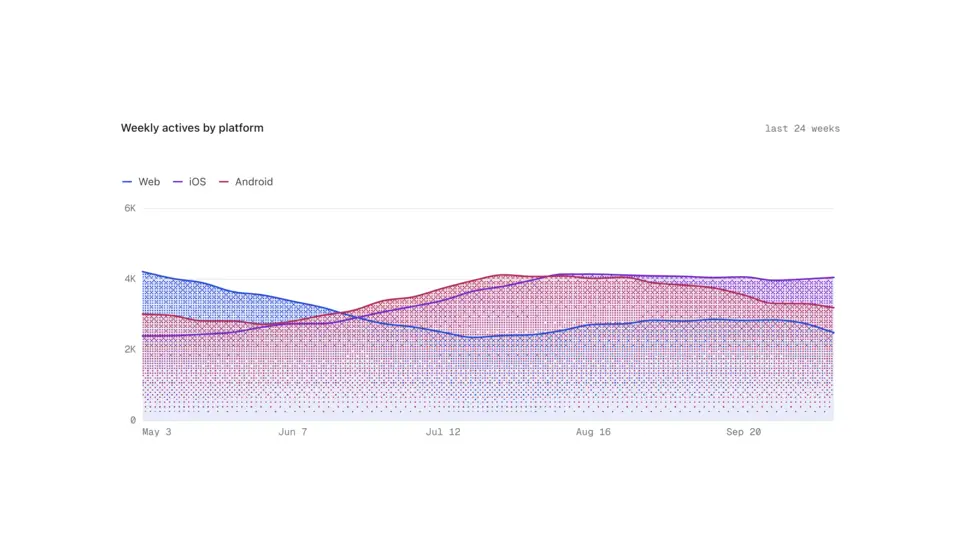
Dither Line Chart
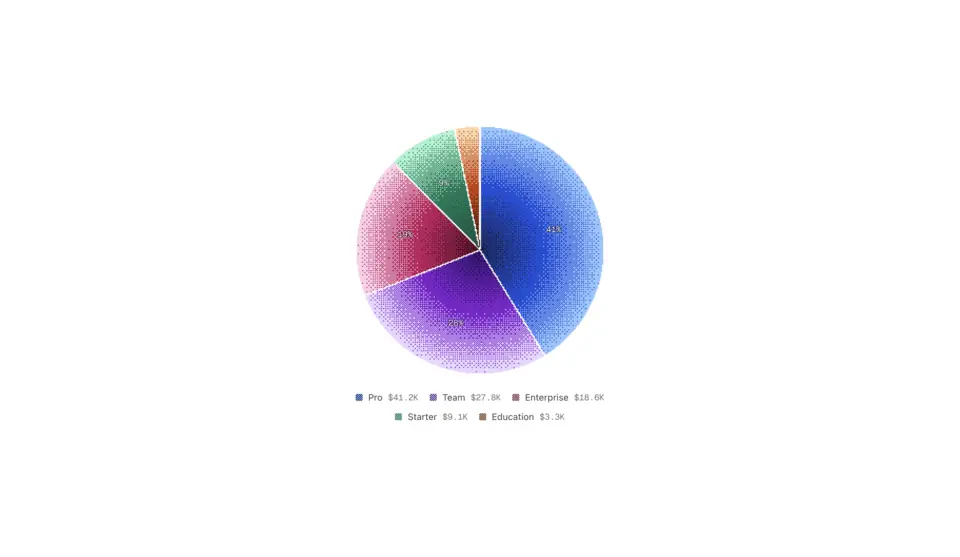
Dither Pie
FAQ
- Do the charts need a charting library?
- No. They are drawn by hand in SVG and canvas with the dither and shader fills, take plain arrays as data, and come with hover detail, keyboard access and a screen-reader description of the data.
- How do I install the components in Charts?
- With the shadcn CLI. Each component page lists its exact command: free components install from a public URL (npx shadcn add https://useplanes.com/r/<name>.json), Pro components install by name (npx shadcn add @useplanes/<name>) after npx @useplanes/cli init --key <key>.
- Do they work with Next.js App Router and Tailwind CSS v4?
- Yes. Every component is a React 19 client component styled with Tailwind CSS v4, and works in Next.js App Router, Vite, or any React app with Tailwind CSS v4.
- Are the components in Charts free?
- They are part of Planes Pro, a one-time license that covers every component and future additions. The catalog also has free components in other categories.
- What do they depend on?
- Motion (formerly Framer Motion) is the only runtime animation dependency. The CLI writes the .tsx source into your project, so there is no Planes package to keep updated.